
How Much Should a Dental Practice Spend on Marketing?
How much should a dental practice spend on marketing? Between 3% and 5% of annual collections to hold its position, and 6% to 9% to actively grow. For a practice collecting $1.2 million, that is roughly $3,000 to $9,000 per month including ad spend. The percentage is a sanity check, not a budget. The real number is worked backward from your cost per new patient and your production target.

Moaz Arshad
• 9 min read

How much should a dental practice spend on marketing?
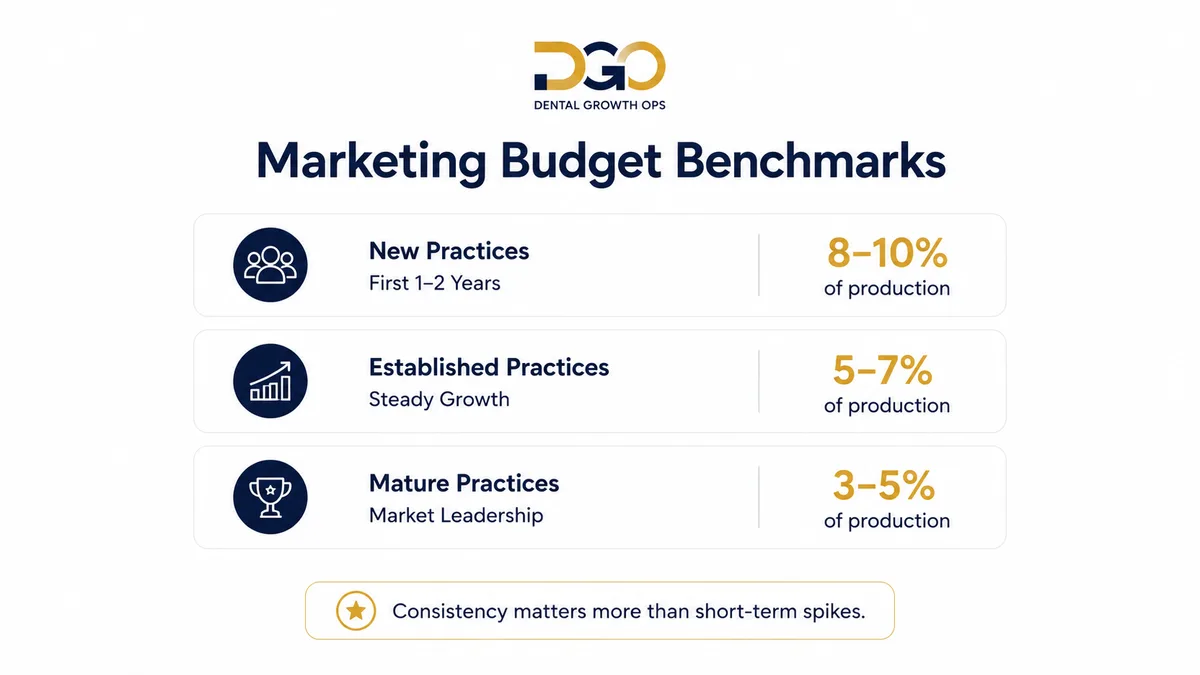
Most general dental practices should budget 3% to 9% of annual collections for marketing, with the position inside that band set by growth stage rather than practice size. Here is how the ranges break down in practice:
- Established practice, holding steady: 3% to 5% of collections. Enough to defend map pack position, keep reviews flowing, and replace natural patient attrition of roughly 15% per year.
- Growth mode, actively adding chair time: 6% to 9% of collections. This is where most practices with open capacity should sit.
- Startup or de novo practice, first 18 months: 10% to 15% of projected collections. You are buying market awareness from zero, so the percentage is temporarily distorted.
- Multi-location group or DSO: 5% to 8% at group level, with per-location budgets weighted toward the newest and weakest locations, not split evenly.
In dollars, a solo practice collecting $800,000 lands at $2,000 to $6,000 per month. A $1.5 million practice lands at $4,000 to $11,000 per month. A three-location group collecting $5 million lands at $20,000 to $33,000 per month. Those figures include both ad spend and agency management fees, which are two separate line items we break down further below.
Why the "spend 3% to 5% of revenue" rule is incomplete
The percentage rule is backward-looking, and that is its fundamental flaw. It sets this year's dental marketing budget from last year's collections, so the practices that most need to grow get the smallest budgets. Four more problems with treating marketing budget percentage of revenue as the whole answer:
- It ignores capacity. A practice with 12 open hygiene hours per week and two idle operatories has a very different problem than one booked out six weeks. Open chair time is the constraint the budget should be sized against.
- It ignores cost per new patient. New patient acquisition cost in downtown Toronto or Phoenix runs two to three times what it costs in a suburban market of 40,000 people. Same percentage, very different patient volume.
- It ignores conversion infrastructure. Spending 8% of collections on ads that route to a site loading in six seconds and a front desk that returns calls in three hours produces a fraction of the patients it should.
- It treats marketing as a tax, not an input. A percentage is something you pay. A cost per new patient is something you buy. The second framing produces better decisions every time.
Keep the percentage. Use it as a guardrail at the end of the calculation, not the starting point.
Method 1: The percentage-of-collections method
Use collections, not production, as the base. Production includes treatment you diagnosed and delivered but have not been paid for, and insurance write-offs can put a 15% to 25% gap between the two numbers. Budgeting off production quietly inflates your spend.
The formula is simple: last 12 months collections × target percentage ÷ 12 = monthly dental marketing budget. A practice collecting $1,000,000 at a 6% growth-mode target gets $60,000 per year, or $5,000 per month.
This method has one legitimate job: setting an upper bound. If the CPNP math below tells you to spend $14,000 per month on a practice collecting $900,000, that is 18% of collections and the plan is wrong somewhere, usually in an unrealistic new patient target or a market where your cost per new patient is too high to buy growth at that pace. Use the percentage as the reality check, then move on.
Method 2: The cost-per-new-patient method (the one we recommend)
The smartest way to set a dental marketing budget is to multiply the new patients you need by what one new patient costs to acquire in your market. The formula is:
Monthly marketing budget = new patients needed per month × target cost per new patient (CPNP)
Your CPNP is total marketing investment for the month, ad spend plus agency fees plus tools, divided by the number of new patients who actually sat in a chair that month. Not leads. Not calls. Booked and seen new patients. Most practices that have never measured this are shocked by the first number, because they have been quietly counting form fills as patients.
Worked example 1: a $1.2M practice targeting 30 new patients per month
A general practice collecting $1.2 million wants 30 new patients per month. Its market CPNP, blended across organic search and paid channels, is $200.
- 30 new patients × $200 CPNP = $6,000 per month total marketing investment
- $6,000 × 12 = $72,000 per year
- $72,000 ÷ $1,200,000 = 6% of collections, which sits inside the growth-mode guardrail
Now check the return. At an average first-year production per new patient of $850, those 30 patients generate $25,500 in production per month against $6,000 of spend. That is a 4.25x return on marketing investment before you count recall, hygiene reactivation, or family members who follow the first patient in. The budget is defensible because it was derived from a number the owner can verify in their practice management software.
What is a good cost per new patient for a dentist?
A good cost per new patient for general dentistry is $150 to $300 in most US and Canadian markets. That figure moves sharply with the treatment you are targeting, because the production behind the patient moves with it:
- General and hygiene new patients: $75 to $200 when organic search and reviews carry the load, $150 to $300 through paid channels.
- Emergency and same-day patients: $100 to $250. High intent, high competition, short consideration window.
- Cosmetic cases (Invisalign, veneers, whitening): $250 to $600. Longer decision cycles and more expensive clicks.
- Implants and full-arch: $500 to $1,500. A $1,200 acquisition cost against a $22,000 full-arch case is a strong trade, which is why practices that reject a $600 CPNP on principle are usually leaving the most profitable production on the table.
Channel matters as much as procedure. Paid search CPNP stays roughly flat for as long as you run it, because you rent the position. Organic CPNP falls every month you invest, because the asset compounds. A practice 14 months into a dental SEO program commonly sees organic CPNP under $80 while its Google Ads CPNP holds at $220. That divergence is the entire argument for funding both instead of picking one.
Method 3: The production-target method
Start with the production gap you want to close, then convert it into patients and dollars. This is the method to use when the practice owner has a specific revenue number in mind for next year.
Required new production ÷ average first-year production per new patient = new patients needed. New patients needed × CPNP = marketing budget.
Worked example 2: closing a $300,000 production gap
A practice at $1.2 million in collections wants to reach $1.5 million next year. The gap is $300,000 in new production.
- $300,000 ÷ $900 average first-year production per new patient = 334 additional new patients per year
- 334 ÷ 12 = 28 additional new patients per month
- 28 × $200 CPNP = $5,600 per month, or $67,200 per year
- $67,200 ÷ $1,500,000 target collections = 4.5% of collections, comfortably inside the guardrail
The spend is 22% of the incremental production it generates, so roughly 78 cents of every new dollar stays in the practice before variable costs. Run one more check before approving it: 28 additional new patients per month needs 28 additional exam slots and the hygiene capacity to recall them. If the schedule cannot absorb that, the constraint is operational rather than financial, and the budget should be phased in over two quarters instead of switched on at full volume.
"Your marketing budget is not a percentage of what you earned last year. It is the number of new patients you need, multiplied by what one costs to acquire in your market."
Want a Budget Built Around Your Actual Numbers?
We scope every engagement to your collections, your capacity, and your target cost per new patient. See how our dental marketing pricing is structured, then book a call and we will run this math on your practice.
Book a Strategy CallWhere does a dental marketing budget actually go?
A healthy dental marketing budget splits roughly 50% to 65% into ad spend, 30% to 45% into management and creative, and 5% to 10% into tools. Taking the $6,000 budget from the first worked example, a typical allocation looks like this:
- Ad spend, $3,300. Roughly $2,400 to Google Ads and $900 to Meta Ads, paid directly to the platforms.
- Management and creative, $2,300. Local SEO work, campaign management, landing pages, ad creative, and reporting.
- Tools, $400. CRM, call tracking numbers, review request platform, scheduling integrations. Most practices land between $100 and $500 per month here.
Ad spend and agency fees must stay separate line items. When an agency quotes one blended number, you cannot see what percentage of your money reached a patient's screen. You should own the Google Ads and Meta accounts, see the platform invoices directly, and be able to walk away with the account history intact. Any arrangement that hides the split is designed to protect the agency's margin, not your CPNP. This is exactly why our pricing model keeps ad budgets separate from management fees, and it is the first thing to ask about when comparing proposals.
What different dental marketing budgets realistically buy
Every market has a minimum viable spend below which the money produces nothing. Google Ads in a mid-size dental market needs roughly $1,500 per month to generate enough click volume for the campaign to optimize; in a competitive metro it is closer to $3,000. Split $900 across three channels and you fund none of them past that threshold. Here is what each tier realistically returns:
- Under $1,500 per month: Google Business Profile optimization, review generation, and foundational local SEO only. No meaningful paid ads. Expect 2 to 5 new patients per month, arriving in month four or later.
- $2,500 to $4,000 per month: Local SEO plus a focused Google Ads campaign with $1,200 to $1,800 in actual ad spend. Expect 6 to 12 new patients per month once campaigns mature.
- $5,000 to $8,000 per month: Full local SEO, Google Ads and Meta Ads, CRM automation, and a review engine running together. Expect 15 to 30 new patients per month. This is where most single-location practices with growth targets belong.
- $10,000 to $20,000+ per month: Multi-location coverage, high-value implant and cosmetic campaigns, video production, and brand-level work. Expect 40+ new patients per month across locations.
Common dental marketing budget mistakes
Five budgeting errors account for most of the wasted dental advertising budget we see when auditing practices:
- Spending under the threshold. $800 per month spread across Google Ads, Facebook, and an SEO retainer buys three half-funded channels and zero patients. One channel funded properly beats three funded partially, every time.
- No tracking, so no CPNP. Without call tracking numbers per channel, form source capture, and a "how did you hear about us" field enforced at check-in, you cannot tell which half of the budget works. Practices in this position usually cut the channel that is working, because it is the one without a slick dashboard.
- Cutting spend the month the schedule fills. Marketing generates patients on a 30 to 90 day delay. Turning it off in a full month creates a hole in the schedule two months later, which triggers panic spending, which restarts the learning curve. The whipsaw costs more than steady spend would have.
- Counting leads instead of booked patients. A channel producing 40 leads at a 20% book rate is worse than one producing 15 leads at a 70% book rate, and reporting that stops at lead volume hides that completely.
- Judging results in 30 days. Google Ads needs 60 to 90 days to stabilize. Local SEO needs 4 to 6 months for meaningful map pack movement. Budget for the full window or do not start.
A sixth mistake underpins the other five: treating marketing as a cost center. A cost gets minimized. An investment gets measured and scaled.
How do you measure return on marketing investment in dentistry?
Track two numbers every month: cost per new patient and return on marketing investment. Both are simple arithmetic once the tracking exists.
- CPNP = total marketing investment ÷ new patients seen that month.
- ROMI = (new patient production − marketing investment) ÷ marketing investment.
A well-run dental marketing program should return 4x to 7x on first-year production, and considerably more against patient lifetime value, which runs $1,000 to $3,000+ depending on treatment mix and recall retention. New patient acquisition remains one of the strongest growth drivers available to an independent practice, which is why the measurement discipline matters more than the exact budget figure. For wider practice management guidance alongside your marketing numbers, the American Dental Association is the primary professional resource in the US.
To make those numbers trustworthy, instrument four things: a unique tracking number per marketing channel, source capture on every web form, source attribution recorded in the practice management software at check-in, and a CRM that connects the original inquiry to the appointment that eventually happened. Our dental CRM automation exists largely to close that last gap, because attribution that breaks between the lead and the booked visit is why most practices cannot calculate their real cost per new patient. If paid search is the piece you are least sure about, our breakdown of what a $5,000 monthly Google Ads budget actually buys shows the channel-level math.
Set the budget from CPNP and production targets, check it against the percentage guardrail, keep ad spend visible and separate, and review the CPNP every 30 days. That process produces a number you can defend to your accountant and adjust with confidence. If you want us to run it on your practice, get in touch and we will build the model with your collections, capacity, and market data.
Moaz Arshad
Founder of Dental Growth Ops. Dental-only marketing specialist focused on new patient acquisition, local SEO, and paid media for dental clinics in the US and Canada.
More about us →